F1 RACE RESULT VISUALIZATION USING PYTHON, POLARS, AND ‘GREAT TABLES’: 2024 AUSTRALIAN GP
Programmatically create an F1 race analysis table using the FastF1 API, the Great Tables library, and Polars
Published
February 15, 2025
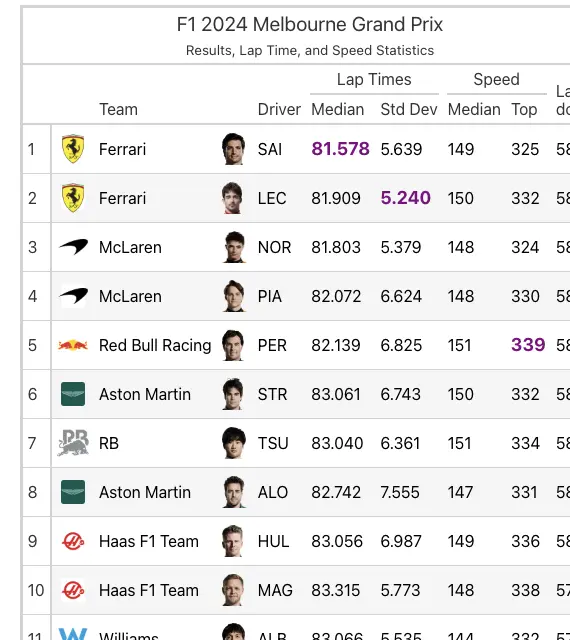
Screenshot of 2024 F1 Australian Grand Prix Data Table
_
Background
As an F1 fan, I always like to prepare for an upcoming race by looking up results and stats about the circuit from the previous year or earlier. I’ve always found this process to be a bit cumbersome as I would usually only find the final results but no other meaningful data, at least not all in one place. I decided to tackle this in a way that could be repeatable for future races. I had recently stumbled upon the Great Tables project which I thought would be a nice compact way to summarize the results & stats that I care about. I also know most of the raw data is available via the awesome FastF1 project. Finally this would be an opportunity for me to test out the pandas alternative, Polars, which many have been praising for its ease of use and speed. Let’s go.
FastF1 API (Python Library providing historical F1 race and telemetry data)
Polars (Pandas alternative Dataframe library built in Rust designed for speeeeed)
Great Tables (Python based library to make great looking display tables)
Importing modules and basic setup
import polars as plimport fastf1# set max rows to display to 50pl.Config.set_tbl_rows(50)# Find the specific racesesh = fastf1.get_session(2024, 'Melbourne', 'R')# Load the race data into local cachesesh.load()
req WARNING DEFAULT CACHE ENABLED! (275.4 MB) /Users/foo/Library/Caches/fastf1
core INFO Loading data for Australian Grand Prix - Race [v3.4.4]
req INFO Using cached data for session_info
req INFO Using cached data for driver_info
req INFO Using cached data for session_status_data
req INFO Using cached data for lap_count
req INFO Using cached data for track_status_data
req INFO Using cached data for _extended_timing_data
req INFO Using cached data for timing_app_data
core INFO Processing timing data...
req INFO Using cached data for car_data
req INFO Using cached data for position_data
req INFO Using cached data for weather_data
req INFO Using cached data for race_control_messages
core INFO Finished loading data for 19 drivers: ['55', '16', '4', '81', '11', '18', '22', '14', '27', '20', '23', '3', '10', '77', '24', '31', '63', '44', '1']
For reference, a slice of the session results table
Get each driver’s median and top speed from car_data telemetry
# Fetch the data using a list comprehensionspeed = [ [i[0], int(i[1]['Speed'].median()), int(i[1]['Speed'].max())] for i in sesh.car_data.items() ]# Just FYI how to get the flat list of all speeds from telemetry# pl.DataFrame([list(i[1]['Speed']) for i in sesh.car_data.items()]).unpivot()# Load it into a Polars Dataframe reorienting it so each driver get his own rowspeed_df = pl.DataFrame(speed, schema=['DriverNumber','Median Speed','Top Speed'], orient='row')speed_df
laps = pl.DataFrame( [{'Team':i[1]['Team'],'Driver':i[1]['Driver'],'LapNumber':int(i[1]['LapNumber']),'LapTime':i[1]['LapTime'].seconds*1.0+ i[1]['LapTime'].microseconds/1000000 } for i in sesh.laps.iterlaps() ], strict=False)# Drop rows with any NaNslaps = laps.fill_nan(None).drop_nulls()laps
shape: (995, 4)
Team
Driver
LapNumber
LapTime
str
str
i64
f64
"Red Bull Racing"
"VER"
1
87.458
"Red Bull Racing"
"VER"
2
84.099
"Red Bull Racing"
"VER"
3
83.115
"Alpine"
"GAS"
1
97.304
"Alpine"
"GAS"
2
84.649
"Alpine"
"GAS"
3
83.851
"Alpine"
"GAS"
4
83.7
"Alpine"
"GAS"
5
84.526
"Alpine"
"GAS"
6
83.912
"Alpine"
"GAS"
7
83.445
"Alpine"
"GAS"
8
83.879
"Alpine"
"GAS"
9
83.829
"Alpine"
"GAS"
10
83.856
"Alpine"
"GAS"
11
85.397
"Alpine"
"GAS"
12
84.625
"Alpine"
"GAS"
13
84.049
"Alpine"
"GAS"
14
84.104
"Alpine"
"GAS"
15
84.1
"Alpine"
"GAS"
16
85.367
"Alpine"
"GAS"
17
117.788
"Alpine"
"GAS"
18
89.888
"Alpine"
"GAS"
19
83.922
"Alpine"
"GAS"
20
83.662
"Alpine"
"GAS"
21
83.241
"Alpine"
"GAS"
22
83.045
…
…
…
…
"McLaren"
"PIA"
34
82.238
"McLaren"
"PIA"
35
82.059
"McLaren"
"PIA"
36
82.047
"McLaren"
"PIA"
37
81.89
"McLaren"
"PIA"
38
85.203
"McLaren"
"PIA"
39
96.781
"McLaren"
"PIA"
40
86.93
"McLaren"
"PIA"
41
81.424
"McLaren"
"PIA"
42
81.08
"McLaren"
"PIA"
43
80.485
"McLaren"
"PIA"
44
80.395
"McLaren"
"PIA"
45
80.223
"McLaren"
"PIA"
46
80.615
"McLaren"
"PIA"
47
80.682
"McLaren"
"PIA"
48
80.588
"McLaren"
"PIA"
49
80.352
"McLaren"
"PIA"
50
80.496
"McLaren"
"PIA"
51
80.718
"McLaren"
"PIA"
52
80.295
"McLaren"
"PIA"
53
80.308
"McLaren"
"PIA"
54
80.199
"McLaren"
"PIA"
55
80.754
"McLaren"
"PIA"
56
80.357
"McLaren"
"PIA"
57
85.255
"McLaren"
"PIA"
58
124.363
Calculate aggregate lap stats per driver into a separate dataframe using group_by
results = pl.DataFrame(sesh.results).select(['DriverNumber','Abbreviation','Status','Position']).rename({'Abbreviation':'Driver'})# Convert position to Intresults = results.cast({'Position': pl.Int8})results
shape: (19, 4)
DriverNumber
Driver
Status
Position
str
str
str
i8
"55"
"SAI"
"Finished"
1
"16"
"LEC"
"Finished"
2
"4"
"NOR"
"Finished"
3
"81"
"PIA"
"Finished"
4
"11"
"PER"
"Finished"
5
"18"
"STR"
"Finished"
6
"22"
"TSU"
"Finished"
7
"14"
"ALO"
"Finished"
8
"27"
"HUL"
"Finished"
9
"20"
"MAG"
"+1 Lap"
10
"23"
"ALB"
"+1 Lap"
11
"3"
"RIC"
"+1 Lap"
12
"10"
"GAS"
"+1 Lap"
13
"77"
"BOT"
"+1 Lap"
14
"24"
"ZHO"
"+1 Lap"
15
"31"
"OCO"
"+1 Lap"
16
"63"
"RUS"
"Accident"
17
"44"
"HAM"
"Engine"
18
"1"
"VER"
"Brakes"
19
Join the above Speed, Lap, and results into a single table
final = speed_df.join(results, on='DriverNumber')final = stats.join(final, on='Driver')final
shape: (19, 10)
Team
Driver
Median
Std Dev
Laps
DriverNumber
Median Speed
Top Speed
Status
Position
str
str
f64
f64
i64
str
i64
i64
str
i8
"Ferrari"
"SAI"
81.578
5.638844
58
"55"
149
325
"Finished"
1
"Ferrari"
"LEC"
81.9085
5.240059
58
"16"
150
332
"Finished"
2
"McLaren"
"NOR"
81.803
5.37894
58
"4"
148
324
"Finished"
3
"McLaren"
"PIA"
82.072
6.62356
58
"81"
148
330
"Finished"
4
"Red Bull Racing"
"PER"
82.139
6.824686
58
"11"
151
339
"Finished"
5
"Aston Martin"
"STR"
83.061
6.743054
58
"18"
150
332
"Finished"
6
"RB"
"TSU"
83.04
6.360524
58
"22"
151
334
"Finished"
7
"Aston Martin"
"ALO"
82.7415
7.554687
58
"14"
147
331
"Finished"
8
"Haas F1 Team"
"HUL"
83.0565
6.98707
58
"27"
149
336
"Finished"
9
"Haas F1 Team"
"MAG"
83.315
5.773301
57
"20"
148
338
"+1 Lap"
10
"Williams"
"ALB"
83.066
5.535442
57
"23"
144
332
"+1 Lap"
11
"RB"
"RIC"
83.105
6.085147
57
"3"
147
334
"+1 Lap"
12
"Alpine"
"GAS"
83.245
7.519535
57
"10"
147
337
"+1 Lap"
13
"Kick Sauber"
"BOT"
82.976
8.316051
57
"77"
149
327
"+1 Lap"
14
"Kick Sauber"
"ZHO"
83.196
7.547661
57
"24"
144
332
"+1 Lap"
15
"Alpine"
"OCO"
82.989
7.817079
57
"31"
146
335
"+1 Lap"
16
"Mercedes"
"RUS"
82.7065
4.021696
56
"63"
147
331
"Accident"
17
"Mercedes"
"HAM"
83.436
4.340289
15
"44"
0
331
"Engine"
18
"Red Bull Racing"
"VER"
84.099
2.277161
3
"1"
0
320
"Brakes"
19
Populate graphics metadata to reference later
import globdef get_insig(team):if team.lower() =='rb':return'racing-bulls-logo'else:return team.lower().replace(' ','-').replace('-f1-team','')mugs = [ glob.glob(F'img/f1-drivers/F1-{name[0] + name[1:].lower()}*')[0] for name in final['Driver'] ]insigs = [ glob.glob(F'img/f1-teams/{get_insig(team)}*')[0] for team in final['Team'] ]final.insert_column(0, pl.Series('insigs', insigs))final.insert_column(2, pl.Series('mugs', mugs))
shape: (19, 12)
insigs
Team
mugs
Driver
Median
Std Dev
Laps
DriverNumber
Median Speed
Top Speed
Status
Position
str
str
str
str
f64
f64
i64
str
i64
i64
str
i8
"img/f1-teams/ferrari-logo.png"
"Ferrari"
"img/f1-drivers/F1-Sainz.png"
"SAI"
81.578
5.638844
58
"55"
149
325
"Finished"
1
"img/f1-teams/ferrari-logo.png"
"Ferrari"
"img/f1-drivers/F1-Leclerc.png"
"LEC"
81.9085
5.240059
58
"16"
150
332
"Finished"
2
"img/f1-teams/mclaren-logo.png"
"McLaren"
"img/f1-drivers/F1-Norris.png"
"NOR"
81.803
5.37894
58
"4"
148
324
"Finished"
3
"img/f1-teams/mclaren-logo.png"
"McLaren"
"img/f1-drivers/F1-Piastri.png"
"PIA"
82.072
6.62356
58
"81"
148
330
"Finished"
4
"img/f1-teams/red-bull-racing-l…
"Red Bull Racing"
"img/f1-drivers/F1-Perez.png"
"PER"
82.139
6.824686
58
"11"
151
339
"Finished"
5
"img/f1-teams/aston-martin-logo…
"Aston Martin"
"img/f1-drivers/F1-Stroll.png"
"STR"
83.061
6.743054
58
"18"
150
332
"Finished"
6
"img/f1-teams/racing-bulls-logo…
"RB"
"img/f1-drivers/F1-Tsunoda.png"
"TSU"
83.04
6.360524
58
"22"
151
334
"Finished"
7
"img/f1-teams/aston-martin-logo…
"Aston Martin"
"img/f1-drivers/F1-Alonso.png"
"ALO"
82.7415
7.554687
58
"14"
147
331
"Finished"
8
"img/f1-teams/haas-logo.png"
"Haas F1 Team"
"img/f1-drivers/F1-Hulkenberg.p…
"HUL"
83.0565
6.98707
58
"27"
149
336
"Finished"
9
"img/f1-teams/haas-logo.png"
"Haas F1 Team"
"img/f1-drivers/F1-Magnussen.pn…
"MAG"
83.315
5.773301
57
"20"
148
338
"+1 Lap"
10
"img/f1-teams/williams-logo.png"
"Williams"
"img/f1-drivers/F1-Albon.png"
"ALB"
83.066
5.535442
57
"23"
144
332
"+1 Lap"
11
"img/f1-teams/racing-bulls-logo…
"RB"
"img/f1-drivers/F1-Ricciardo.pn…
"RIC"
83.105
6.085147
57
"3"
147
334
"+1 Lap"
12
"img/f1-teams/alpine-logo.png"
"Alpine"
"img/f1-drivers/F1-Gasly.png"
"GAS"
83.245
7.519535
57
"10"
147
337
"+1 Lap"
13
"img/f1-teams/kick-sauber-logo.…
"Kick Sauber"
"img/f1-drivers/F1-Bottas.png"
"BOT"
82.976
8.316051
57
"77"
149
327
"+1 Lap"
14
"img/f1-teams/kick-sauber-logo.…
"Kick Sauber"
"img/f1-drivers/F1-Zhou.png"
"ZHO"
83.196
7.547661
57
"24"
144
332
"+1 Lap"
15
"img/f1-teams/alpine-logo.png"
"Alpine"
"img/f1-drivers/F1-Ocon.png"
"OCO"
82.989
7.817079
57
"31"
146
335
"+1 Lap"
16
"img/f1-teams/mercedes-logo.png"
"Mercedes"
"img/f1-drivers/F1-Russell.png"
"RUS"
82.7065
4.021696
56
"63"
147
331
"Accident"
17
"img/f1-teams/mercedes-logo.png"
"Mercedes"
"img/f1-drivers/F1-Hamilton.png"
"HAM"
83.436
4.340289
15
"44"
0
331
"Engine"
18
"img/f1-teams/red-bull-racing-l…
"Red Bull Racing"
"img/f1-drivers/F1-Verstappen.p…
"VER"
84.099
2.277161
3
"1"
0
320
"Brakes"
19
Generate Lap summary row
# Calculate univeral median and standard deviation for all lap timesrace_median = laps['LapTime'].median()race_stddev = laps['LapTime'].std()# Add above summary data to the main dataframe# Need to look into a more efficient way to do this using *align* or similarsummary = pl.DataFrame({'insigs':[None,],'Team': ['SUMMARY',],'mugs':[None,],'Driver': [None,],'Median': [race_median,],'Std Dev': [race_stddev,],'Laps': [None,],'DriverNumber': [None,],'Median Speed': [None,],'Top Speed': [None,],'Status': ['Finished',],'Position': [None,]})final = pl.concat([final, summary])final
shape: (20, 12)
insigs
Team
mugs
Driver
Median
Std Dev
Laps
DriverNumber
Median Speed
Top Speed
Status
Position
str
str
str
str
f64
f64
i64
str
i64
i64
str
i8
"img/f1-teams/ferrari-logo.png"
"Ferrari"
"img/f1-drivers/F1-Sainz.png"
"SAI"
81.578
5.638844
58
"55"
149
325
"Finished"
1
"img/f1-teams/ferrari-logo.png"
"Ferrari"
"img/f1-drivers/F1-Leclerc.png"
"LEC"
81.9085
5.240059
58
"16"
150
332
"Finished"
2
"img/f1-teams/mclaren-logo.png"
"McLaren"
"img/f1-drivers/F1-Norris.png"
"NOR"
81.803
5.37894
58
"4"
148
324
"Finished"
3
"img/f1-teams/mclaren-logo.png"
"McLaren"
"img/f1-drivers/F1-Piastri.png"
"PIA"
82.072
6.62356
58
"81"
148
330
"Finished"
4
"img/f1-teams/red-bull-racing-l…
"Red Bull Racing"
"img/f1-drivers/F1-Perez.png"
"PER"
82.139
6.824686
58
"11"
151
339
"Finished"
5
"img/f1-teams/aston-martin-logo…
"Aston Martin"
"img/f1-drivers/F1-Stroll.png"
"STR"
83.061
6.743054
58
"18"
150
332
"Finished"
6
"img/f1-teams/racing-bulls-logo…
"RB"
"img/f1-drivers/F1-Tsunoda.png"
"TSU"
83.04
6.360524
58
"22"
151
334
"Finished"
7
"img/f1-teams/aston-martin-logo…
"Aston Martin"
"img/f1-drivers/F1-Alonso.png"
"ALO"
82.7415
7.554687
58
"14"
147
331
"Finished"
8
"img/f1-teams/haas-logo.png"
"Haas F1 Team"
"img/f1-drivers/F1-Hulkenberg.p…
"HUL"
83.0565
6.98707
58
"27"
149
336
"Finished"
9
"img/f1-teams/haas-logo.png"
"Haas F1 Team"
"img/f1-drivers/F1-Magnussen.pn…
"MAG"
83.315
5.773301
57
"20"
148
338
"+1 Lap"
10
"img/f1-teams/williams-logo.png"
"Williams"
"img/f1-drivers/F1-Albon.png"
"ALB"
83.066
5.535442
57
"23"
144
332
"+1 Lap"
11
"img/f1-teams/racing-bulls-logo…
"RB"
"img/f1-drivers/F1-Ricciardo.pn…
"RIC"
83.105
6.085147
57
"3"
147
334
"+1 Lap"
12
"img/f1-teams/alpine-logo.png"
"Alpine"
"img/f1-drivers/F1-Gasly.png"
"GAS"
83.245
7.519535
57
"10"
147
337
"+1 Lap"
13
"img/f1-teams/kick-sauber-logo.…
"Kick Sauber"
"img/f1-drivers/F1-Bottas.png"
"BOT"
82.976
8.316051
57
"77"
149
327
"+1 Lap"
14
"img/f1-teams/kick-sauber-logo.…
"Kick Sauber"
"img/f1-drivers/F1-Zhou.png"
"ZHO"
83.196
7.547661
57
"24"
144
332
"+1 Lap"
15
"img/f1-teams/alpine-logo.png"
"Alpine"
"img/f1-drivers/F1-Ocon.png"
"OCO"
82.989
7.817079
57
"31"
146
335
"+1 Lap"
16
"img/f1-teams/mercedes-logo.png"
"Mercedes"
"img/f1-drivers/F1-Russell.png"
"RUS"
82.7065
4.021696
56
"63"
147
331
"Accident"
17
"img/f1-teams/mercedes-logo.png"
"Mercedes"
"img/f1-drivers/F1-Hamilton.png"
"HAM"
83.436
4.340289
15
"44"
0
331
"Engine"
18
"img/f1-teams/red-bull-racing-l…
"Red Bull Racing"
"img/f1-drivers/F1-Verstappen.p…
"VER"
84.099
2.277161
3
"1"
0
320
"Brakes"
19
null
"SUMMARY"
null
null
82.852
6.514701
null
null
null
null
"Finished"
null
Generate the final display table
There’s a lot to unpack here so I commented each layer of the display table object inline as I saw fit, which was facilitated by Polars and GT’s chaining style syntax. Honestly though most of this is very self-explanatory.
from great_tables import GT, md, html, loc, style# Polars expression function to determine if a driver did not DNFstatus_color = ( pl.when(pl.col("Status").str.contains('Finished|1 Lap')) .then(pl.lit("black")) .otherwise(pl.lit("grey")))# Create the Great Tables objectmelbourne_2024 = (# Pull out the Position column to use as a Row names (1,2,3 ..) GT(final, rowname_col ="Position") .cols_move_to_end( columns="Laps" ) .tab_header( title="F1 2024 Australian Grand Prix", subtitle="Results, Lap Time, and Speed Statistics", ) .tab_options( table_background_color="white" )# I'm not sure that this actually works .opt_row_striping(row_striping=False)# Create a table border .opt_table_outline()# Set decimal place limits for certain columns .fmt_number( columns=["Median", "Std Dev"], decimals=3 )# Handle image alignments .fmt_image("insigs").cols_align(align="left") .fmt_image("mugs").cols_align(align="left")# Suppress image column labels .cols_label( insigs="", mugs="" ).# Redo some column labels cols_label({'Median Speed':'Median','Top Speed':'Top','Laps':html('Laps<br>done') })# Create groupings of related columns .tab_spanner( label="Lap Times", columns=["Median","Std Dev"] ) .tab_spanner( label="Speed", columns=["Median Speed","Top Speed"] )# Suppress columns that were only used for internal reference .cols_hide( columns=["Status","DriverNumber"] )# Fix Summary Row Name .sub_missing( columns=["Position"], missing_text="-" )# Replace any missing data with empty string .sub_missing(missing_text="")# Display driver's row text in grey if they did not finish the race (from function above) .tab_style( style=style.text(color=status_color), locations=loc.body() )# Highlight lowest median lap time .tab_style( style.text(weight ="bolder", color="purple", size="large"), loc.body( columns = ["Median"], rows = pl.col("Median") == pl.col("Median").filter(pl.col("Status").str.contains('Finished|1 Lap')).min() ) )# Highlight top speed .tab_style( style.text(weight ="bolder", color="purple", size="large"), loc.body( columns = ["Top Speed"], rows = pl.col("Top Speed") == pl.col("Top Speed").filter(pl.col("Status").str.contains('Finished|1 Lap')).max() ) )# Highlight lowest standard deviation lap time (most consistent) .tab_style( style.text(weight ="bolder", color="purple", size="large"), loc.body( columns = ["Std Dev"], rows = pl.col("Std Dev") == pl.col("Std Dev").filter(pl.col("Status").str.contains('Finished|1 Lap')).min() ) ) .tab_source_note(source_note="Source data from FastF1"))melbourne_2024.show(target='notebook')
F1 2024 Australian Grand Prix
Results, Lap Time, and Speed Statistics
Team
Driver
Lap Times
Speed
Laps
done
Median
Std Dev
Median
Top
1
Ferrari
SAI
81.578
5.639
149
325
58
2
Ferrari
LEC
81.909
5.240
150
332
58
3
McLaren
NOR
81.803
5.379
148
324
58
4
McLaren
PIA
82.072
6.624
148
330
58
5
Red Bull Racing
PER
82.139
6.825
151
339
58
6
Aston Martin
STR
83.061
6.743
150
332
58
7
RB
TSU
83.040
6.361
151
334
58
8
Aston Martin
ALO
82.742
7.555
147
331
58
9
Haas F1 Team
HUL
83.056
6.987
149
336
58
10
Haas F1 Team
MAG
83.315
5.773
148
338
57
11
Williams
ALB
83.066
5.535
144
332
57
12
RB
RIC
83.105
6.085
147
334
57
13
Alpine
GAS
83.245
7.520
147
337
57
14
Kick Sauber
BOT
82.976
8.316
149
327
57
15
Kick Sauber
ZHO
83.196
7.548
144
332
57
16
Alpine
OCO
82.989
7.817
146
335
57
17
Mercedes
RUS
82.707
4.022
147
331
56
18
Mercedes
HAM
83.436
4.340
0
331
15
19
Red Bull Racing
VER
84.099
2.277
0
320
3
-
SUMMARY
82.852
6.515
Source data from FastF1
Note: I notice that the graphics do not appear on mobile devices in portrait mode which might a way that Great Tables managees responsive sizing. Turning to landscape should remedy this.
There you have it!
I am really impressed by Great Tables ability to create easily reproducible quick n’ dirty stats that are dense but also aesthetically pleasing. Based on the above I get a basic overview of how a race went down, which drivers had good consistent pace, and perhaps which ones were running with less downforce (higher top speeds). I also like how the graphics help to quickly identify the team/driver which saves me a few mental cycles.
There’s so much more data available from FastF1 that I’ve barely scratched the surface with this. Other data points we could consider adding:
Historical number of DNFs (useful for fantasy)
Sector info
Historical weather data
Throttle data
Race result position compared to qualifying outcome
Great Tables also has support for inline graphics similar to sparklines which I didn’t think would be too useful for this exercise because the number of laps would be way too dense. Rather a heatmap style graphic would work better to illustrate distributions of data but there is no native support for this so it’d probably have to be some kind of manual solution.
Hope you enjoyed this. Happy upcoming F1 2025 season! Stay tuned for updates.